Gender and Technology Blog Diversity
Gender and Technology Blog Diversity
…..Since my final exam schedule got messed up since I got sick I thought that I should take advantage of my position and do a final project that no one else could have done and that would benefit from having all of the other final projects and papers up on the blog. Long story short, after some thinking I decided that I wanted to see if the class succeeded at increasing the diversity of the blog over the course of the semester as I had hoped that we would since the first panels when we first began graphing the demographics of our representations in class. I used some of the axes that we included and those that we never discussed that seemed interesting to create a survey of references centered on different searchable demographics. In the end I collected 2045 references from January 19th to May 25th and produced 9 sets of graphs and pie charts.
…..I began this project by brainstorming categories adding in some suggestions from Laura and Anne. I ended up with eight categories: race, class, gender, sex, sexuality, age, location, and religion. Next I decided on terms to divide the categories into. For example, for race I decided on the terms White, Black, Asian, Hispanic/Latino/a, and Other Race. After that I came up with keywords and all their possible variations that might work and occur commonly enough that the words might result in at least one hit. Using a combination of the WordPress and Google search capabilities I searched for the keywords in the blog and tallied the number of times the keywords included in a term were used. I added in the Google search engine once I discovered that the WordPress search function does not support any way to look for one term without another one (man -woman). Although I could do much more with the Google search, Google was less reliable with finding all of the keywords, so I used the WordPress search whenever I could. When keywords were included in larger unrelated words or might be taken out of context I looked into each post personally using Ctrl-F to find the location of the word. As I went along I divided the tallies by week. After I finally had finished collecting all of the data for a category I entered it into Microsoft Excel (a program that I wasn’t too familiar with before this). At last once all of the data collection for all of the categories was finished I isolated each category and made line graphs and pie charts to better display the information.
…..There are many things wrong with this study due to its very nature. This project is a good view of what is physically typed and clarified on the blog, but so much goes assumed that can’t be searched or known that it makes a fully accurate portrayal of the class’s representation of demographics impossible. In addition to this problem the study is victim to all of my own human tendencies and errors. This is a project built out of the keywords generated from my head, counted in many searches and windows, and tallied by hand over many hours. Although I have done my best, another person could come up with different results to those shown below. As a psychology major I have to acknowledge that this experiment does not have the most ideal design, but due to the nature and timing involved it would be very difficult to do this perfectly and it would have to be run by a complicated computer script with a long list of keywords after surveying every word and letter of every post. To include inferences and visible assumptions a set of diverse people would have to comb the entire blog without conferring and still come up with similar results. It may not be the perfect experiment, but it’s a good approximation, really interesting, and I’m proud of it.
…..All of the graphs and interesting information is available for your perusal immediately below. I have not included the list of keywords I used or the original data from my searches so that everyone doesn’t have to muck through all of the details to get the larger picture. If you want the specifics comment and I’ll find some way to put up the lists and tables without killing the formatting.
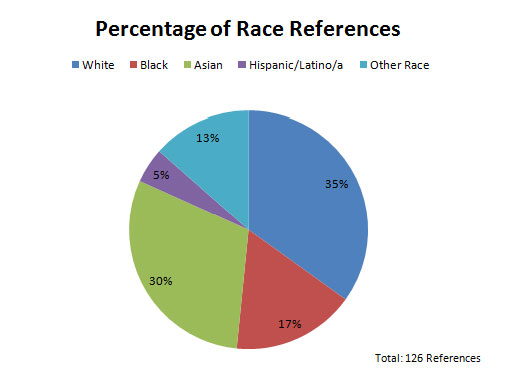
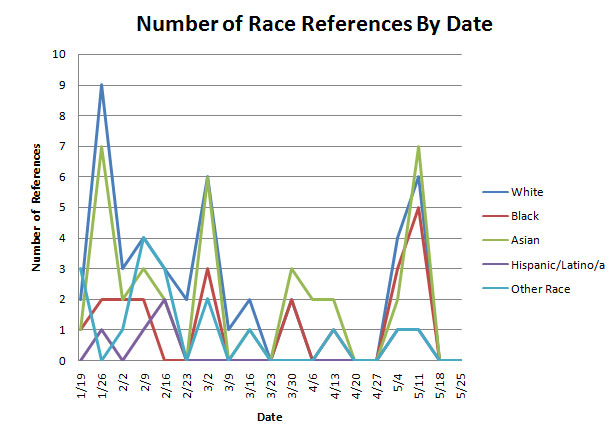
Race Discussion:
…..I was surprised that the number of Asian mentions outnumbered Black/African American mentions, but, considering the large amount of people and countries within Asia, I suppose it kind of makes sense. There seem to be three main peaks here: January 26th, March 2nd, and May 11th. The week of January 26th was when we were all still making introductions and we had just begun to make our first posts on the relationship between gender and technology. The week of March 2nd was the second panel (“collectively gendered uses of technology”) and our second web papers. The week of May 11th was a portion of the final paper rush. As a note, since ‘black and white’ meaning simple, distinct boundaries or divisions occurs far too often in the blog for my comfort. All of the results for black and white were carefully combed through to give you the results above. On the other hand, I simply collected and counted the results for Asian with only a couple quick checks for context. It’s interesting how we don’t often refer to other races with a collective color name though I do appreciate Maddie’s extensive list of races including “blue, orange, tye-dye” from her post “‘Mom! I passed!’…” I hope that she will excuse me for not including those in my other race count.
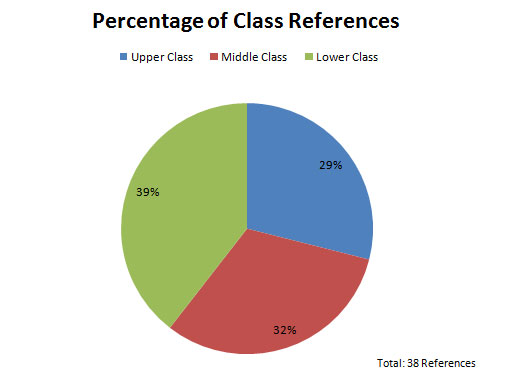
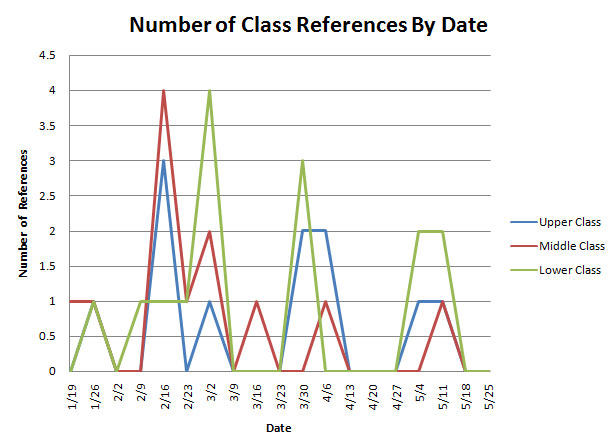
Class Discussion:
…..So here we see that the order is lower, middle, and then upper class in terms of the percentage of references. Of course, like I said before, you have to remember that part of the tricky thing about this is an additional force shaping these results. We often assume that the middle or upper class is ‘normal’ and omit the class reference if we think of it as assumed. In this way lower class specific typed in references might be more common because, unlike upper and middle class, we feel like we must clarify our frame of reference. The peaks here are at 2/16 for the middle and upper classes which coincides with the first panel when we represented individuals, 3/2 for lower class during the second panel and the second web papers, 3/30 for lower and upper classes when we were just finishing The Handmaid’s Tale and had just begun discussing Watchmen as well as posting our third web papers, and 5/4-5/11 for lower class in the final papers.
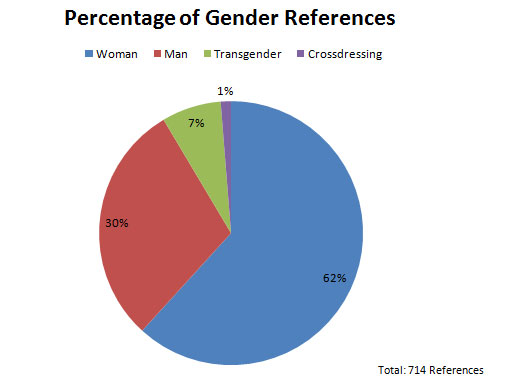
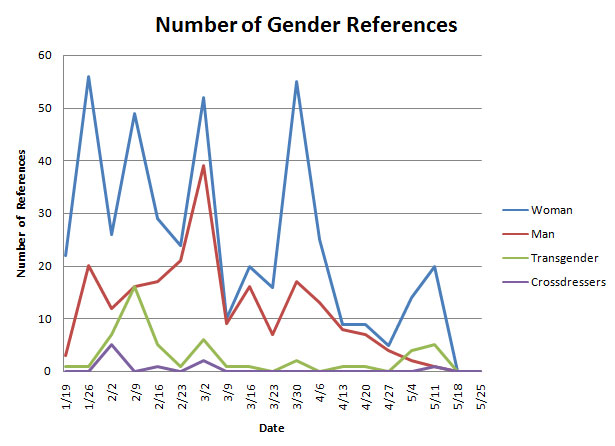
Gender Discussion:
…..Here we see a very distinct tendency towards posting about and discussing women in a gender-related class. I included cross-dressing in this chart out of curiosity. It fit in this chart better than in the others, so here it is. It appears that transgender and cross-dressing did the best during the time that we discussed transsexual, transgendered, and intersexual individuals. After that those topics pretty much fizzled out until a small revival in the final papers. As you can see, women did very well across the chart with peaks at 1/26 (introductions and first posts), 2/9 (trans topics and first papers), 3/2 (second papers), and 3/30 (Watchmen and third papers). Man, like many other categories, did best on 3/2 with the papers on the panels. Both man and woman had a steep fall down for spring break (3/9) When I originally intended to search for the word man I did not anticipate how many difficulties I would face with the overlap with woman, many, and other common words. For both man and woman I included their girl and boy in the keywords since I noticed that this was a common form of address for the genders on the blog in reference to both children and adults.
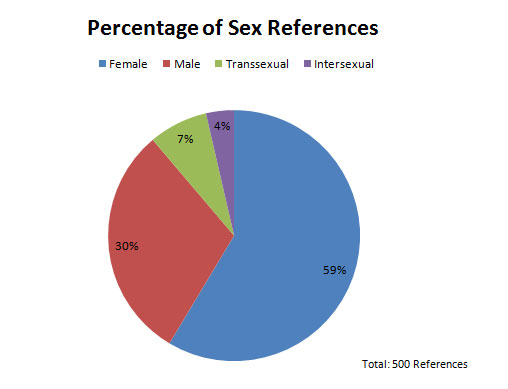
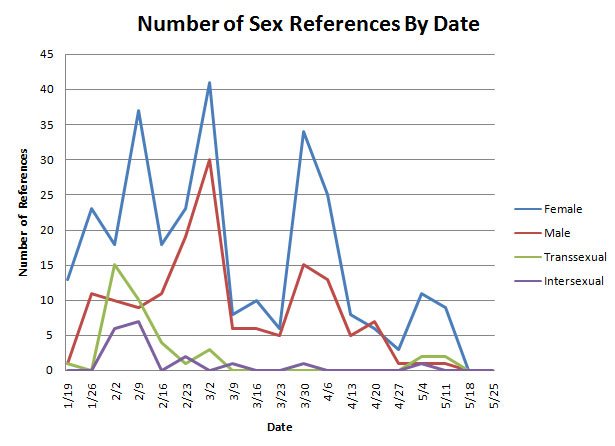
Sex Discussion:
…..Similar to the gender reference data, there is a large amount of data for female and a smaller amount for male. Transsexual and intersexual look very similar to transgender and cross-dressing with the same spike during our discussion of trans and intersexual topics. There are similarities between the gender and sex information since the terms are often used interchangeably in the blog. The male and female references spiked at the common date ranges for the papers and panels with a noticeable decrease for the final papers.
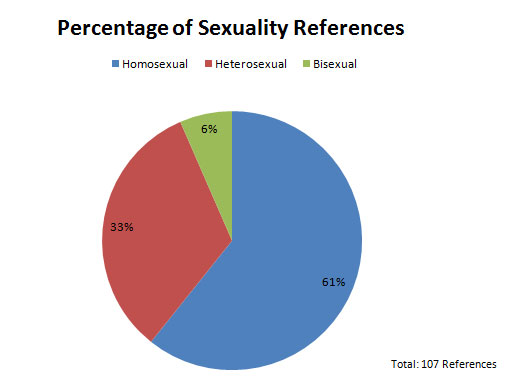
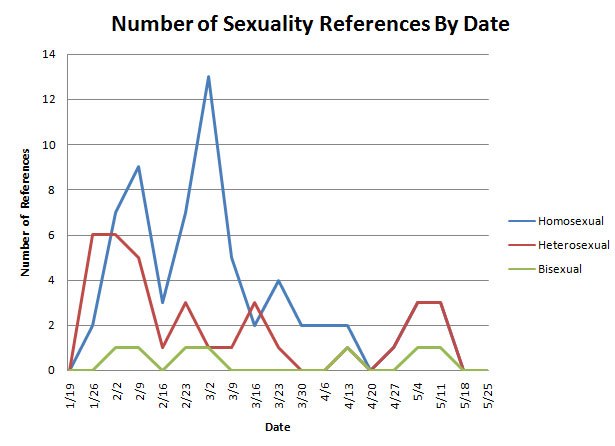
Sexuality Discussion:
…..Here you can see that homosexual keywords were most often typed in the blog. While heterosexual and straight were the only keywords I used for the heterosexual category, my homosexual search included homosexual, gay, and lesbian. Queer has such an eternally elusive definition depending on each context and each person’s idea of the term that I did not use it as a keyword under any of the three categories here. In retrospect it might have been interesting to include it in this graph as well, but for the time being I will have to be satisfied with these results. Yet again, the omitting and assuming the heteronormative skews the results as to who we are actually representing in our posts. Interestingly enough all 3 terms weren’t so popular for the final papers. Although it is not visible in this graph the homosexual line follows the heterosexual line after the week of 4/20 began.
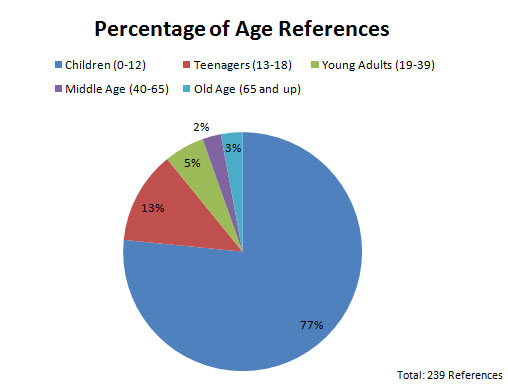
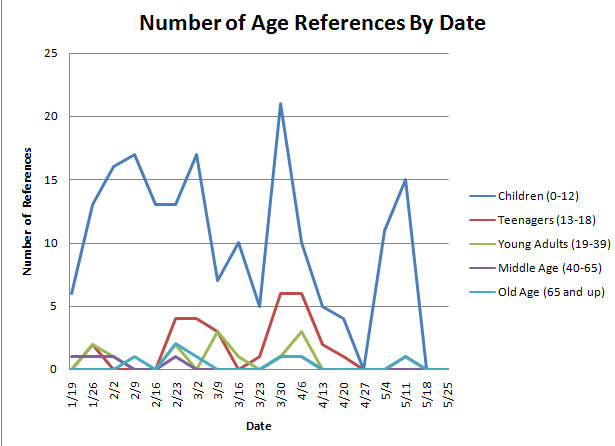
Age Discussion:
…..It is really difficult to target keywords for age. First of all it was difficult to find out and decide on what years counted as what age groups. I ended up compromising with a bunch of different definitions of the age groups that I found off of the internet although I’m still not completely satisfied with them. Then trying to think of keywords that would pick up as many references from the blog was difficult. There are so many different ways to state or suggest a person’s age so I tried to keep an eye out for age reference patterns and mentions that might be difficult to find again in the future when I was searching for keywords for other categories. I know that I didn’t catch all of the age references in the blog, but this is a pretty good sampling. Children displayed the most results. This is possibly due to the fact that it was the easiest age group to search for and included the terms girl and boy (with context checks) which I had found to be a plentiful resource in the gender category. There were very few mentions of older adults. Also, the young adult count could be considered higher due to the large amount of introduction posts that the students in class (mostly young adults) wrote up at the beginning of the semester. However, since very few of the introductions actually listed the age of the author, I did not include my assumption of ages into the results. This is an interesting graph with children soaring above the other terms that are wandering around the bottom. The biggest peak here is the week of 3/30 during the third paper assignment and our discussion of Watchmen.
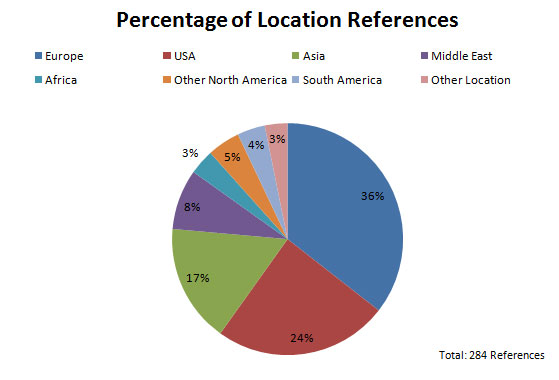
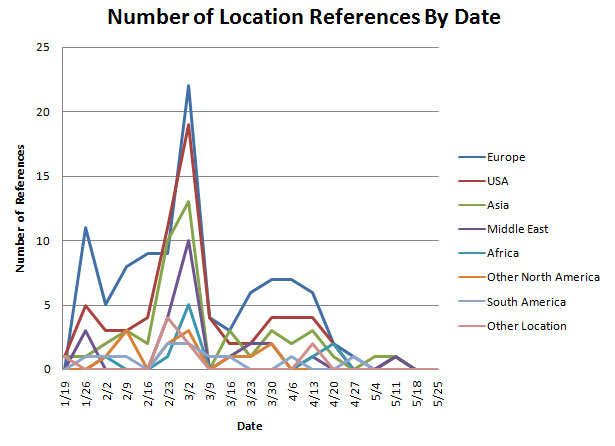
Location Discussion:
…..Like the age data, locations were particularly difficult to pinpoint since there are just so many possibilities and variations. I kept a look out for keywords during other searches and searched for a large selection of countries and a smaller selection of cities. The USA numbers may be lower due to assumption and naming states instead of the country. I only searched the states that had turned up during my searches for other categories. I broke up Asia and the Middle East to see how the two would compare and the recent increased interest regarding the area. The Asia term includes a humongous amount of selections including China, Japan, Russia, and India. The Other North America term includes Mexico and Central American countries as well. The Other Locations term was pretty much a mixing bowl for whatever didn’t fit the other categories like Australia. I was pleasantly surprised to find that searching Antarctica for the Other Locations term actually returned a result which made the fruitless search for many of the other uncategorized locations worth it. Every term peaked on the week of 3/2 for the second panel and paper.
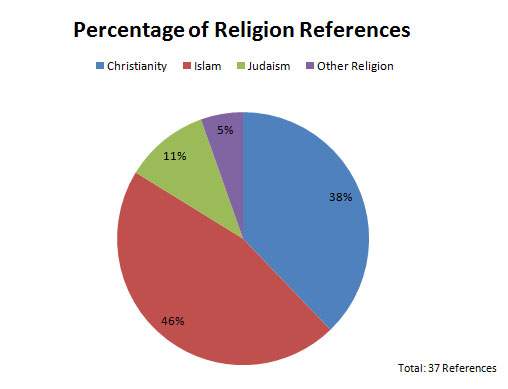
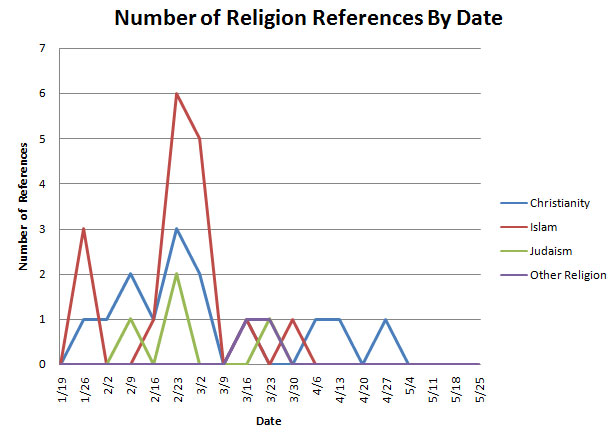
Religion Discussion:
…..Most of the data aligned with Islam, followed by Christianity. I searched for keywords for the religions, branches of the religion, and any special group that might be mentioned. I had expected more Christianity references especially with the larger range of keywords available. Although I did try searching for all of the branches of Buddhism and some of the primary deities of Hinduism I only found one result for each. I had originally planned to have them as separate categories, but due to the small amount of data they fit into the Other Religion term which wasn’t having much luck with the Rastafari Movement, Shinto, and Sikhism among others. The religion references were most common with our discussion on the movie and book of The Handmaid’s Tale (2/23-3/2) and then tapered off with no mentions in the final papers.
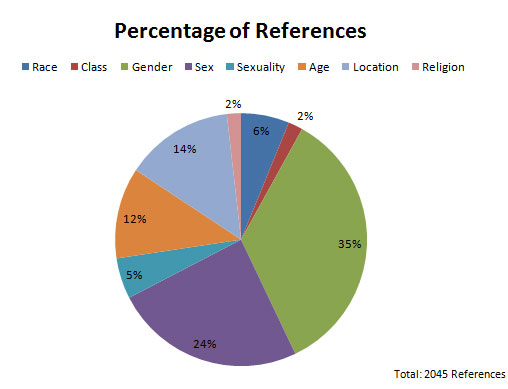
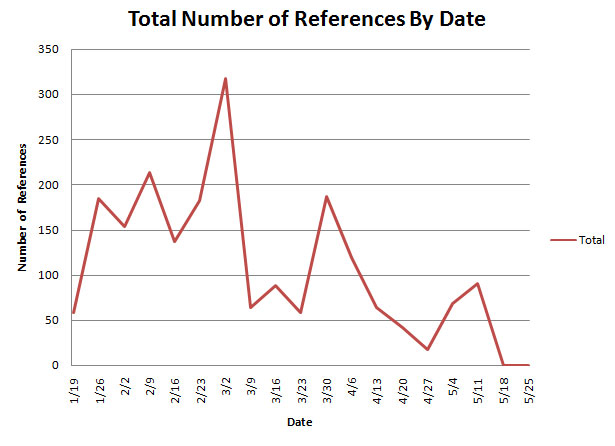
Total References Discussion:
…..Some reference categories did better than others like gender and sex, but others were mentioned less, very keyword-dependent, and popular contenders for assumption and omission. The first two smaller peaks occurred during the class introductions and our first posts (1/26) as well as the first web papers and our exploration of non-normative gender and sexual identities (2/9). The spike at 3/2, like I have mentioned many times before, is during the second panel and the second web papers. The smallest peak found at 3/16 is right after spring break when we began discussing Metropolis and the book version of The Handmaid’s Tale. The week of 3/30 found us finishing our discussion of The Handmaid’s Tale, beginning the discussion of Watchmen, and writing up our third web papers. The downturn at 4/27 was when we were posting our Multimedia Projects which often had very little text to search. The last hurrah at 5/11 represents the influx of final paper posts at that time.
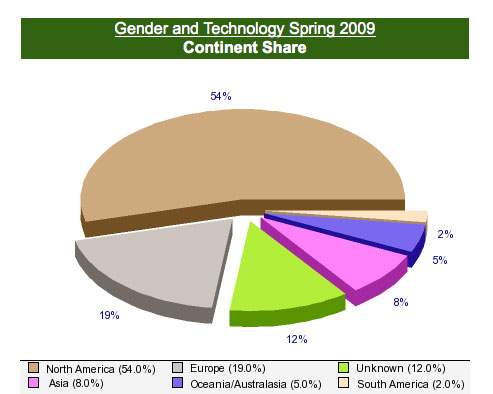
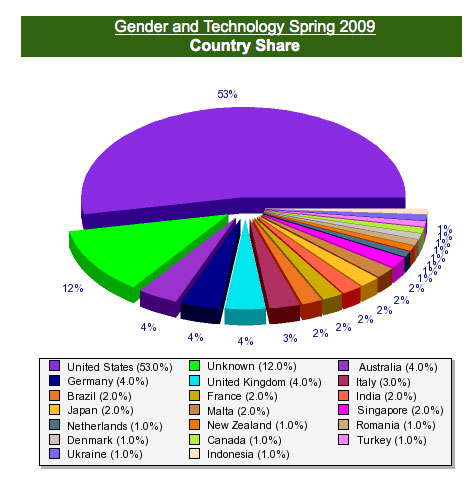
Note: Below I have included two pie charts that I got from Laura about the location breakdown for visitors to the blog by continent and then by country. They are an interesting addition to the graphs that I made from my own data.